在 Amazon Bedrock 上使用 DeepSeek-R1 的 RAG
本教程演示如何使用 Amazon OpenSearch Service 和 DeepSeek-R1 模型实现检索增强生成 (RAG)。
如果您使用的是自管型 OpenSearch 而非 Amazon OpenSearch Service,请使用此蓝图为 DeepSeek-R1 模型创建连接器。有关创建连接器的更多信息,请参阅连接器。然后直接转到步骤 4。
将以 your_ 为前缀的占位符替换为您自己的值。
先决条件
开始之前,请满足以下先决条件。
配置 Amazon 设置时,只更改本教程中提到的值。将所有其他设置保留为默认值。
将 DeepSeek-R1 部署到 Amazon Bedrock
在 Amazon Bedrock 上部署 DeepSeek-R1。有关更多信息,请参阅 Amazon Bedrock。记下 Amazon Bedrock DeepSeek-R1 模型 Amazon 资源名称 (ARN);您将在后续步骤中使用它。
创建 OpenSearch 集群
前往 Amazon OpenSearch Service 控制台并创建一个 OpenSearch 域。
记下域 ARN 和 URL;您将在后续步骤中使用它们。
步骤 1:为 Amazon Bedrock 访问创建 IAM 角色
要在 Amazon Bedrock 上调用 DeepSeek-R1 模型,您必须创建具有适当权限的 AWS Identity and Access Management (IAM) 角色。连接器将使用此角色来调用模型。
转到 IAM 控制台,创建一个名为 my_invoke_bedrock_deepseek_model_role 的新 IAM 角色,并添加以下信任策略和权限
- 自定义信任策略
{
    "Version": "2012-10-17",
    "Statement": [
        {
            "Effect": "Allow",
            "Principal": {
                "Service": "es.amazonaws.com"
            },
            "Action": "sts:AssumeRole"
        }
    ]
}
- 权限
{
    "Version": "2012-10-17",
    "Statement": [
        {
            "Action": [
                "bedrock:InvokeModel"
            ],
            "Effect": "Allow",
            "Resource": "your_DeepSeek_R1_model_ARN"
        }
    ]
}
记下角色 ARN;您将在后续步骤中使用它。
步骤 2:在 Amazon OpenSearch Service 中配置 IAM 角色
按照以下步骤在 Amazon OpenSearch Service 中配置 IAM 角色。
步骤 2.1:创建用于签署连接器请求的 IAM 角色
专门为签署您的创建连接器 API 请求生成一个新的 IAM 角色。
创建一个名为 my_create_bedrock_deepseek_connector_role 的 IAM 角色,并添加以下信任策略和权限
- 自定义信任策略
{
  "Version": "2012-10-17",
  "Statement": [
    {
      "Effect": "Allow",
      "Principal": {
        "AWS": "your_iam_user_arn"
      },
      "Action": "sts:AssumeRole"
    }
  ]
}
您将在步骤 3.1 中使用 your_iam_user_arn IAM 用户来承担此角色。
- 权限
{
  "Version": "2012-10-17",
  "Statement": [
    {
      "Effect": "Allow",
      "Action": "iam:PassRole",
      "Resource": "your_iam_role_arn_created_in_step1"
    },
    {
      "Effect": "Allow",
      "Action": "es:ESHttpPost",
      "Resource": "your_opensearch_domain_arn"
    }
  ]
}
记下此角色 ARN;您将在后续步骤中使用它。
步骤 2.2:映射后端角色
按照以下步骤映射后端角色
- 登录 OpenSearch Dashboards,并在顶部菜单中选择 Security(安全)。
- 选择 Roles(角色),然后选择 ml_full_access 角色。
- 在 ml_full_access 角色详情页面,选择 Mapped users(已映射用户),然后选择 Manage mapping(管理映射)。
- 在“后端角色”字段中输入在步骤 2.1 中创建的 IAM 角色 ARN,如下图所示。
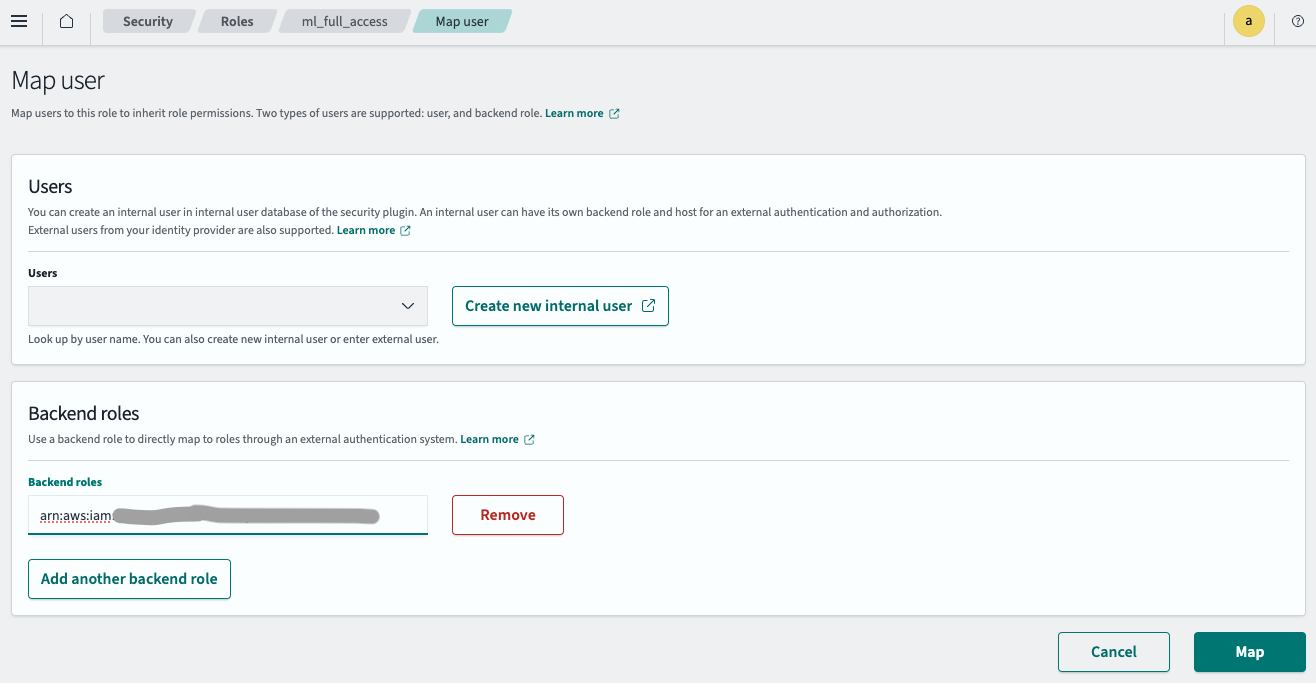
- 选择 Map(映射)。
IAM 角色现已成功在您的 OpenSearch 集群中配置。
步骤 3:创建连接器
按照以下步骤为 DeepSeek-R1 模型创建连接器。有关创建连接器的更多信息,请参阅连接器。
步骤 3.1:获取临时凭证
使用步骤 2.1 中指定的 IAM 用户的凭证来承担角色
aws sts assume-role --role-arn your_iam_role_arn_created_in_step2.1 --role-session-name your_session_name
从响应中复制临时凭证,并将其配置在 ~/.aws/credentials 中
[default]
AWS_ACCESS_KEY_ID=your_access_key_of_role_created_in_step2.1
AWS_SECRET_ACCESS_KEY=your_secret_key_of_role_created_in_step2.1
AWS_SESSION_TOKEN=your_session_token_of_role_created_in_step2.1
步骤 3.2:创建连接器
使用在 ~/.aws/credentials 中配置的临时凭证运行以下 Python 代码
import boto3
import requests
from requests_aws4auth import AWS4Auth

host = 'your_amazon_opensearch_domain_endpoint'
region = 'your_amazon_opensearch_domain_region'
service = 'es'

credentials = boto3.Session().get_credentials()
awsauth = AWS4Auth(credentials.access_key, credentials.secret_key, region, service, session_token=credentials.token)

path = '/_plugins/_ml/connectors/_create'
url = host + path

payload = {
  "name": "DeepSeek R1 model connector",
  "description": "Connector for my Bedrock DeepSeek model",
  "version": "1.0",
  "protocol": "aws_sigv4",
  "credential": {
    "roleArn": "your_iam_role_arn_created_in_step1"
  },
  "parameters": {
    "service_name": "bedrock",
    "region": "your_bedrock_model_region",
    "model_id": "your_deepseek_bedrock_model_arn",
    "temperature": 0,
    "max_gen_len": 4000
  },
  "actions": [
    {
      "action_type": "PREDICT",
      "method": "POST",
      "url": "https://bedrock-runtime.us-east-1.amazonaws.com/model/${parameters.model_id}/invoke",
      "headers": {
        "content-type": "application/json"
      },
      "request_body": "{ \"prompt\": \"<|begin▁of▁sentence|><|User|>${parameters.inputs}<|Assistant|>\", \"temperature\": ${parameters.temperature}, \"max_gen_len\": ${parameters.max_gen_len} }",
      "post_process_function": "\n      return '{' +\n               '\"name\": \"response\",'+\n               '\"dataAsMap\": {' +\n                  '\"completion\":\"' + escape(params.generation) + '\"}' +\n             '}';\n    "
    }
  ]
}

headers = {"Content-Type": "application/json"}

r = requests.post(url, auth=awsauth, json=payload, headers=headers)
print(r.status_code)
print(r.text)
脚本将输出连接器 ID
{"connector_id":"HnS5sJQBVQUimUskjpFl"}
记下连接器 ID;您将在下一步中使用它。
步骤 4:创建并测试模型
登录 OpenSearch Dashboards,打开 DevTools 控制台,并运行以下请求以创建和测试 DeepSeek-R1 模型。
-
创建模型组
POST /_plugins/_ml/model_groups/_register { "name": "Bedrock DeepSeek model", "description": "Test model group for Bedrock DeepSeek model" }响应包含模型组 ID
{ "model_group_id": "Vylgs5QBts7fa6bylR0v", "status": "CREATED" } -
注册模型
POST /_plugins/_ml/models/_register { "name": "Bedrock DeepSeek R1 model", "function_name": "remote", "description": "DeepSeek R1 model on Bedrock", "model_group_id": "Vylgs5QBts7fa6bylR0v", "connector_id": "KHS7s5QBVQUimUskoZGp" }响应包含模型 ID
{ "task_id": "hOS7s5QBFSAM-Wczv7KD", "status": "CREATED", "model_id": "heS7s5QBFSAM-Wczv7Kb" } -
部署模型
POST /_plugins/_ml/models/heS7s5QBFSAM-Wczv7Kb/_deploy响应包含部署操作的任务 ID
{ "task_id": "euRhs5QBFSAM-WczTrI6", "task_type": "DEPLOY_MODEL", "status": "COMPLETED" } -
测试模型
POST /_plugins/_ml/models/heS7s5QBFSAM-Wczv7Kb/_predict { "parameters": { "inputs": "hello" } }响应包含模型生成的文本
 {
   "inference_results": [
     {
       "output": [
         {
           "name": "response",
           "dataAsMap": {
             "completion": """<think>\n\n</think>\n\nHello! How can I assist you today? 😊"""
           }
         }
       ],
       "status_code": 200
     }
   ]
 }
步骤 5:配置 RAG
按照以下步骤配置 RAG。
步骤 5.1:创建搜索管道
使用 RAG 处理器创建搜索管道
PUT /_search/pipeline/my-conversation-search-pipeline-deepseek
{
  "response_processors": [
    {
      "retrieval_augmented_generation": {
        "tag": "Demo pipeline",
        "description": "Demo pipeline Using DeepSeek R1",
        "model_id": "heS7s5QBFSAM-Wczv7Kb",
        "context_field_list": [
          "text"
        ],
        "system_prompt": "You are a helpful assistant.",
        "user_instructions": "Generate a concise and informative answer in less than 100 words for the given question"
      }
    }
  ]
}
步骤 5.2:创建向量数据库
按照本教程的步骤 1 和 2 创建嵌入模型和向量索引。然后将示例数据摄入到索引中
POST _bulk
{"index": {"_index": "my-nlp-index", "_id": "1"}}
{"text": "Chart and table of population level and growth rate for the Ogden-Layton metro area from 1950 to 2023. United Nations population projections are also included through the year 2035.\nThe current metro area population of Ogden-Layton in 2023 is 750,000, a 1.63% increase from 2022.\nThe metro area population of Ogden-Layton in 2022 was 738,000, a 1.79% increase from 2021.\nThe metro area population of Ogden-Layton in 2021 was 725,000, a 1.97% increase from 2020.\nThe metro area population of Ogden-Layton in 2020 was 711,000, a 2.16% increase from 2019."}
{"index": {"_index": "my-nlp-index", "_id": "2"}}
{"text": "Chart and table of population level and growth rate for the New York City metro area from 1950 to 2023. United Nations population projections are also included through the year 2035.\\nThe current metro area population of New York City in 2023 is 18,937,000, a 0.37% increase from 2022.\\nThe metro area population of New York City in 2022 was 18,867,000, a 0.23% increase from 2021.\\nThe metro area population of New York City in 2021 was 18,823,000, a 0.1% increase from 2020.\\nThe metro area population of New York City in 2020 was 18,804,000, a 0.01% decline from 2019."}
{"index": {"_index": "my-nlp-index", "_id": "3"}}
{"text": "Chart and table of population level and growth rate for the Chicago metro area from 1950 to 2023. United Nations population projections are also included through the year 2035.\\nThe current metro area population of Chicago in 2023 is 8,937,000, a 0.4% increase from 2022.\\nThe metro area population of Chicago in 2022 was 8,901,000, a 0.27% increase from 2021.\\nThe metro area population of Chicago in 2021 was 8,877,000, a 0.14% increase from 2020.\\nThe metro area population of Chicago in 2020 was 8,865,000, a 0.03% increase from 2019."}
{"index": {"_index": "my-nlp-index", "_id": "4"}}
{"text": "Chart and table of population level and growth rate for the Miami metro area from 1950 to 2023. United Nations population projections are also included through the year 2035.\\nThe current metro area population of Miami in 2023 is 6,265,000, a 0.8% increase from 2022.\\nThe metro area population of Miami in 2022 was 6,215,000, a 0.78% increase from 2021.\\nThe metro area population of Miami in 2021 was 6,167,000, a 0.74% increase from 2020.\\nThe metro area population of Miami in 2020 was 6,122,000, a 0.71% increase from 2019."}
{"index": {"_index": "my-nlp-index", "_id": "5"}}
{"text": "Chart and table of population level and growth rate for the Austin metro area from 1950 to 2023. United Nations population projections are also included through the year 2035.\\nThe current metro area population of Austin in 2023 is 2,228,000, a 2.39% increase from 2022.\\nThe metro area population of Austin in 2022 was 2,176,000, a 2.79% increase from 2021.\\nThe metro area population of Austin in 2021 was 2,117,000, a 3.12% increase from 2020.\\nThe metro area population of Austin in 2020 was 2,053,000, a 3.43% increase from 2019."}
{"index": {"_index": "my-nlp-index", "_id": "6"}}
{"text": "Chart and table of population level and growth rate for the Seattle metro area from 1950 to 2023. United Nations population projections are also included through the year 2035.\\nThe current metro area population of Seattle in 2023 is 3,519,000, a 0.86% increase from 2022.\\nThe metro area population of Seattle in 2022 was 3,489,000, a 0.81% increase from 2021.\\nThe metro area population of Seattle in 2021 was 3,461,000, a 0.82% increase from 2020.\\nThe metro area population of Seattle in 2020 was 3,433,000, a 0.79% increase from 2019."}
步骤 5.3:搜索索引
运行向量搜索以从向量数据库中检索文档,并使用 DeepSeek 模型进行 RAG
GET /my-nlp-index/_search?search_pipeline=my-conversation-search-pipeline-deepseek
{
  "query": {
    "neural": {
      "passage_embedding": {
        "query_text": "What's the population increase of New York City from 2021 to 2023? How is the trending comparing with Miami?",
        "model_id": "heS7s5QBFSAM-Wczv7Kb",
        "k": 5
      }
    }
  },
  "size": 2,
  "_source": [
    "text"
  ],
  "ext": {
    "generative_qa_parameters": {
      "llm_model": "bedrock/claude",
      "llm_question": "What's the population increase of New York City from 2021 to 2023? How is the trending comparing with Miami?",
      "context_size": 5,
      "timeout": 15
    }
  }
}
响应包括从向量搜索中检索到的相关文档(在 hits 数组中)以及 DeepSeek 模型生成的答案(在 ext.retrieval_augmented_generation 对象中)
{
  "took": 5,
  "timed_out": false,
  "_shards": {
    "total": 5,
    "successful": 5,
    "skipped": 0,
    "failed": 0
  },
  "hits": {
    "total": {
      "value": 6,
      "relation": "eq"
    },
    "max_score": 0.04107812,
    "hits": [
      {
        "_index": "my-nlp-index",
        "_id": "4",
        "_score": 0.04107812,
        "_source": {
          "text": """Chart and table of population level and growth rate for the Miami metro area from 1950 to 2023. United Nations population projections are also included through the year 2035.\nThe current metro area population of Miami in 2023 is 6,265,000, a 0.8% increase from 2022.\nThe metro area population of Miami in 2022 was 6,215,000, a 0.78% increase from 2021.\nThe metro area population of Miami in 2021 was 6,167,000, a 0.74% increase from 2020.\nThe metro area population of Miami in 2020 was 6,122,000, a 0.71% increase from 2019."""
        }
      },
      {
        "_index": "my-nlp-index",
        "_id": "2",
        "_score": 0.03810156,
        "_source": {
          "text": """Chart and table of population level and growth rate for the New York City metro area from 1950 to 2023. United Nations population projections are also included through the year 2035.\nThe current metro area population of New York City in 2023 is 18,937,000, a 0.37% increase from 2022.\nThe metro area population of New York City in 2022 was 18,867,000, a 0.23% increase from 2021.\nThe metro area population of New York City in 2021 was 18,823,000, a 0.1% increase from 2020.\nThe metro area population of New York City in 2020 was 18,804,000, a 0.01% decline from 2019."""
        }
      }
    ]
  },
  "ext": {
    "retrieval_augmented_generation": {
      "answer": """You are a helpful assistant.\nGenerate a concise and informative answer in less than 100 words for the given question\nSEARCH RESULT 1: Chart and table of population level and growth rate for the Miami metro area from 1950 to 2023. United Nations population projections are also included through the year 2035.\nThe current metro area population of Miami in 2023 is 6,265,000, a 0.8% increase from 2022.\nThe metro area population of Miami in 2022 was 6,215,000, a 0.78% increase from 2021.\nThe metro area population of Miami in 2021 was 6,167,000, a 0.74% increase from 2020.\nThe metro area population of Miami in 2020 was 6,122,000, a 0.71% increase from 2019.\nSEARCH RESULT 2: Chart and table of population level and growth rate for the New York City metro area from 1950 to 2023. United Nations population projections are also included through the year 2035.\nThe current metro area population of New York City in 2023 is 18,937,000, a 0.37% increase from 2022.\nThe metro area population of New York City in 2022 was 18,867,000, a 0.23% increase from 2021.\nThe metro area population of New York City in 2021 was 18,823,000, a 0.1% increase from 2020.\nThe metro area population of New York City in 2020 was 18,804,000, a 0.01% decline from 2019.\nQUESTION: What's the population increase of New York City from 2021 to 2023? How is the trending comparing with Miami?\nOkay, I need to figure out the population increase of New York City from 2021 to 2023 and compare it with Miami's growth. Let me start by looking at the data provided.

From SEARCH RESULT 2, in 2021, NYC's population was 18,823,000, and in 2022, it was 18,867,000. Then in 2023, it's 18,937,000. So, from 2021 to 2022, it increased by 44,000, and from 2022 to 2023, it went up by 70,000. Adding those together, the total increase from 2021 to 2023 is 114,000.

Now, looking at Miami's data in SEARCH RESULT 1, in 2021, the population was 6,167,000, and in 2023, it's 6,265,000. That's an increase of 98,000 over the same period.

Comparing the two, NYC's increase is higher than Miami's. NYC went up by 114,000, while Miami was 98,000. Also, NYC's growth rate is a bit lower than Miami's. NYC's average annual growth rate is around 0.37%, whereas Miami's is about 0.75%. So, while NYC's population increased more in total, Miami's growth rate is higher. I should present this clearly, highlighting both the total increase and the growth rates to show the comparison accurately.
</think>

From 2021 to 2023, New York City's population increased by 114,000, compared to Miami's increase of 98,000. While NYC's total growth is higher, Miami's annual growth rate (0.75%) is notably faster than NYC's (0.37%)."""
    }
  }
}