文本到可视化
这是一个实验性功能,不建议在生产环境中使用。有关该功能进展的更新或如果您想留下反馈,请加入 OpenSearch 论坛的讨论。
OpenSearch Dashboards 助手可以使用自然语言指令创建可视化。
配置
要配置文本到可视化,请按照以下步骤操作。
步骤 1:启用文本到可视化
要启用文本到可视化,请配置以下 opensearch_dashboards.yml 设置
assistant.text2viz.enabled: true
步骤 2:创建代理
为了协调文本到可视化,您需要创建必要的代理。通过发送以下请求,为创建所有必要的文本到可视化代理创建一个工作流模板
请求
POST /_plugins/_flow_framework/workflow
{
  "name": "Text to visualization agents",
  "description": "This template is to create all Agents required for text to visualization",
  "use_case": "REGISTER_AGENTS",
  "version": {
    "template": "1.0.0",
    "compatibility": [
      "2.18.0",
      "3.0.0"
    ]
  },
  "workflows": {
    "provision": {
      "user_params": {},
      "nodes": [
        {
          "id": "create_claude_connector",
          "type": "create_connector",
          "previous_node_inputs": {},
          "user_inputs": {
            "credential": {
              "access_key": "<YOUR_ACCESS_KEY>",
              "secret_key": "<YOUR_SECRET_KEY>",
              "session_token": "<YOUR_SESSION_TOKEN>"
            },
            "parameters": {
              "endpoint": "bedrock-runtime.us-east-1.amazonaws.com",
              "content_type": "application/json",
              "auth": "Sig_V4",
              "max_tokens_to_sample": "8000",
              "service_name": "bedrock",
              "temperature": "0.0000",
              "response_filter": "$.content[0].text",
              "region": "us-east-1",
              "anthropic_version": "bedrock-2023-05-31"
            },
            "version": "1",
            "name": "Claude haiku runtime Connector",
            "protocol": "aws_sigv4",
            "description": "The connector to BedRock service for claude model",
            "actions": [
              {
                "action_type": "predict",
                "method": "POST",
                "url": "https://bedrock-runtime.us-east-1.amazonaws.com/model/anthropic.claude-3-haiku-20240307-v1:0/invoke",
                "headers": {
                  "content-type": "application/json",
                  "x-amz-content-sha256": "required"
                },
                "request_body": "{\"messages\":[{\"role\":\"user\",\"content\":[{\"type\":\"text\",\"text\":\"${parameters.prompt}\"}]}],\"anthropic_version\":\"${parameters.anthropic_version}\",\"max_tokens\":${parameters.max_tokens_to_sample}}"
              }
            ]
          }
        },
        {
          "id": "register_claude_model",
          "type": "register_remote_model",
          "previous_node_inputs": {
            "create_claude_connector": "connector_id"
          },
          "user_inputs": {
            "name": "claude-haiku",
            "description": "Claude model",
            "deploy": true
          }
        },
        {
          "id": "create_t2vega_tool",
          "type": "create_tool",
          "previous_node_inputs": {
            "register_claude_model": "model_id"
          },
          "user_inputs": {
            "parameters": {
              "prompt": "You're an expert at creating vega-lite visualization. No matter what the user asks, you should reply with a valid vega-lite specification in json.\nYour task is to generate Vega-Lite specification in json based on the given sample data, the schema of the data, the PPL query to get the data and the user's input.\nLet's start from dimension and metric/date. Now I have a question, I already transfer it to PPL and query my Opensearch cluster. \nThen I get data. For the PPL, it will do aggregation like \"stats AVG(field_1) as avg, COUNT(field_2) by field_3, field_4, field_5\". \nIn this aggregation, the metric is [avg, COUNT(field_2)] , and then we judge the type of field_3,4,5. If only field_5 is type related to date, the dimension is [field_3, field_4], and date is [field_5]\nFor example, stats SUM(bytes) by span(timestamp, 1w), machine.os, response, then SUM(bytes) is metric and span(timestamp, 1w) is date, while machine.os, response are dimensions.\nNotice: Some fields like 'span()....' will be the date, but not metric and dimension. \nAnd one field will only count once in dimension count. You should always pick field name from schema\nTo summarize,\nA dimension is a categorical variable that is used to group, segment, or categorize data. It is typically a qualitative attribute that provides context for metrics and is used to slice and dice data to see how different categories perform in relation to each other.\nThe dimension is not date related fields. The dimension and date are very closed. The only difference is date is related to datetime, while dimension is not.\nA metric is a quantitative measure used to quantify or calculate some aspect of the data. Metrics are numerical and typically represent aggregated values like sums, averages, counts, or other statistical calculations.\n\nIf a ppl doesn't have aggregation using 'stats', then each field in output is dimension.\nOtherwise, if a ppl use aggregation using 'stats' but doesn't group by using 'by', then each field in output is metric.\n\nThen for each given PPL, you could give the metric and dimension and date. One field will in only one of the metric, dimension or date.\n\nThen according to the metric number and dimension number of PPL result, you should first format the entrance code by metric_number, dimension_number, and date_number. For example, if metric_number = 1, dimension_number = 2, date_number=1, then the entrance code is  121.\nI define several use case categories here according to the entrance code.\nFor each category, I will define the entrance condition (number of metric and dimension)\nI will also give some defined attribute of generated vega-lite. Please refer to it to generate vega-lite.\n\nType 1:\nEntrance code: <1, 1, 0>\nDefined Attributes:\n      {\n      \"title\": \"<title>\",\n      \"description\": \"<description>\",\n      \"mark\": \"bar\",\n      \"encoding\": {\n        \"x\": {\n          \"field\": \"<metric name>\",\n          \"type\": \"quantitative\"\n        },\n        \"y\": {\n          \"field\": \"<dimension name>\",\n          \"type\": \"nominal\"\n        }\n      },\n    }\n\nType 2:\nEntrance code: <1, 2, 0>\nDefined Attributes:\n{\n      \"mark\": \"bar\",\n      \"encoding\": {\n        \"x\": {\n          \"field\": \"<metric 1>\",\n          \"type\": \"quantitative\"\n        },\n        \"y\": {\n          \"field\": \"<dimension 1>\",\n          \"type\": \"nominal\"\n        },\n        \"color\": {\n          \"field\": \"<dimension 2>\",\n          \"type\": \"nominal\"\n        }\n      }\n    }\n\n\nType 3\nEntrance code: <3, 1, 0>\nDefined Attributes:\n{\n    \"mark\": \"point\",\n    \"encoding\": {\n        \"x\": {\n            \"field\": \"<metric 1>\",\n            \"type\": \"quantitative\"\n        },\n        \"y\": {\n            \"field\": \"<metric 2>\",\n            \"type\": \"quantitative\"\n        },\n        \"size\": {\n            \"field\": \"<metric 3>\",\n            \"type\": \"quantitative\"\n        },\n        \"color\": {\n            \"field\": \"<dimension 1>\",\n            \"type\": \"nominal\"\n        }\n    }\n}\n\nType 4\nEntrance code: <2, 1, 0>\nDefined Attributes:\n{\n    \"mark\": \"point\",\n    \"encoding\": {\n        \"x\": {\n            \"field\": \"<mtric 1>\",\n            \"type\": \"quantitative\"\n        },\n        \"y\": {\n            \"field\": \"<metric 2>\",\n            \"type\": \"quantitative\"\n        },\n        \"color\": {\n            \"field\": \"<dimension 1>\",\n            \"type\": \"nominal\"\n        }\n    }\n}\n\nType 5:\nEntrance code: <2, 1, 1>\nDefined Attributes:\n{\n      \"layer\": [\n        {\n          \"mark\": \"bar\",\n          \"encoding\": {\n            \"x\": {\n              \"field\": \"<date 1>\",\n              \"type\": \"temporal\"\n            },\n            \"y\": {\n              \"field\": \"<metric 1>\",\n              \"type\": \"quantitative\",\n              \"axis\": {\n                \"title\": \"<metric 1 name>\"\n              }\n            },\n            \"color\": {\n              \"field\": \"<dimension 1>\",\n              \"type\": \"nominal\"\n            }\n          }\n        },\n        {\n          \"mark\": {\n            \"type\": \"line\",\n            \"color\": \"red\"\n          },\n          \"encoding\": {\n            \"x\": {\n              \"field\": \"<date 1>\",\n              \"type\": \"temporal\"\n            },\n            \"y\": {\n              \"field\": \"<metric 2>\",\n              \"type\": \"quantitative\",\n              \"axis\": {\n                \"title\": \"<metric 2 name>\",\n                \"orient\": \"right\"\n              }\n            },\n            \"color\": {\n              \"field\": \"<dimension 1>\",\n              \"type\": \"nominal\"\n            }\n          }\n        }\n      ],\n      \"resolve\": {\n        \"scale\": {\n          \"y\": \"independent\"\n        }\n      }\n    }\n\nType 6:\nEntrance code: <2, 0, 1>\nDefined Attributes:\n{\n      \"title\": \"<title>\",\n      \"description\": \"<description>\",\n      \"layer\": [\n        {\n          \"mark\": \"area\",\n          \"encoding\": {\n            \"x\": {\n              \"field\": \"<date 1>\",\n              \"type\": \"temporal\"\n            },\n            \"y\": {\n              \"field\": \"<metric 1>\",\n              \"type\": \"quantitative\",\n              \"axis\": {\n                \"title\": \"<metric 1 name>\"\n              }\n            }\n          }\n        },\n        {\n          \"mark\": {\n            \"type\": \"line\",\n            \"color\": \"black\"\n          },\n          \"encoding\": {\n            \"x\": {\n              \"field\": \"date\",\n              \"type\": \"temporal\"\n            },\n            \"y\": {\n              \"field\": \"metric 2\",\n              \"type\": \"quantitative\",\n              \"axis\": {\n                \"title\": \"<metric 2 name>\",\n                \"orient\": \"right\"\n              }\n            }\n          }\n        }\n      ],\n      \"resolve\": {\n        \"scale\": {\n          \"y\": \"independent\"\n        }\n      }\n    }\n    \nType 7:\nEntrance code: <1, 0, 1>\nDefined Attributes:\n{\n      \"title\": \"<title>\",\n      \"description\": \"<description>\",\n      \"mark\": \"line\",\n      \"encoding\": {\n        \"x\": {\n          \"field\": \"<date 1>\",\n          \"type\": \"temporal\",\n          \"axis\": {\n            \"title\": \"<date name>\"\n          }\n        },\n        \"y\": {\n          \"field\": \"<metric 1>\",\n          \"type\": \"quantitative\",\n          \"axis\": {\n            \"title\": \"<metric name>\"\n          }\n        }\n      }\n    }\n\nType 8:\nEntrance code: <1, 1, 1>\nDefined Attributes:\n{\n      \"title\": \"<title>\",\n      \"description\": \"<description>\",\n      \"mark\": \"line\",\n      \"encoding\": {\n        \"x\": {\n          \"field\": \"<date 1>\",\n          \"type\": \"temporal\",\n          \"axis\": {\n            \"title\": \"<date name>\"\n          }\n        },\n        \"y\": {\n          \"field\": \"<metric 1>\",\n          \"type\": \"quantitative\",\n          \"axis\": {\n            \"title\": \"<metric name>\"\n          }\n        },\n        \"color\": {\n          \"field\": \"<dimension 1>\",\n          \"type\": \"nominal\",\n          \"legend\": {\n            \"title\": \"<dimension name>\"\n          }\n        }\n      }\n    }\n\nType 9:\nEntrance code: <1, 2, 1>\nDefined Attributes:\n{\n      \"title\": \"<title>\",\n      \"description\": \"<description>\",\n      \"mark\": \"line\",\n      \"encoding\": {\n        \"x\": {\n          \"field\": \"<date 1>\",\n          \"type\": \"temporal\",\n          \"axis\": {\n            \"title\": \"<date name>\"\n          }\n        },\n        \"y\": {\n          \"field\": \"<metric 1>\",\n          \"type\": \"quantitative\",\n          \"axis\": {\n            \"title\": \"<metric 1>\"\n          }\n        },\n        \"color\": {\n          \"field\": \"<dimension 1>\",\n          \"type\": \"nominal\",\n          \"legend\": {\n            \"title\": \"<dimension 1>\"\n          }\n        },\n        \"facet\": {\n          \"field\": \"<dimension 2>\",\n          \"type\": \"nominal\",\n          \"columns\": 2\n        }\n      }\n    }\n\nType 10:\nEntrance code: all other code\nAll others type.\nUse a table to show the result\n\n\nBesides, here are some requirements:\n1. Do not contain the key called 'data' in vega-lite specification.\n2. If mark.type = point and shape.field is a field of the data, the definition of the shape should be inside the root \"encoding\" object, NOT in the \"mark\" object, for example, {\"encoding\": {\"shape\": {\"field\": \"field_name\"}}}\n3. Please also generate title and description\n\nThe sample data in json format:\n${parameters.sampleData}\n\nThis is the schema of the data:\n${parameters.dataSchema}\n\nThe user used this PPL query to get the data: ${parameters.ppl}\n\nThe user's question is: ${parameters.input_question}\n\nNotice: Some fields like 'span()....' will be the date, but not metric and dimension. \nAnd one field will only count once in dimension count.  You should always pick field name from schema.\n And when you code is <2, 1, 0>, it belongs type 4.\n  And when you code is <1, 2, 0>, it belongs type 9.\n\n\nNow please reply a valid vega-lite specification in json based on above instructions.\nPlease return the number of dimension, metric and date. Then choose the type. \nPlease also return the type.\nFinally return the vega-lite specification according to the type.\nPlease make sure all the key in the schema matches the word I given. \nYour answer format should be:\nNumber of metrics:[list the metric name here, Don't use duplicate name]  <number of metrics {a}>  \nNumber of dimensions:[list the dimension name here]  <number of dimension {b}> \nNumber of dates:[list the date name here]  <number of dates {c}> \nThen format the entrance code by: <Number of metrics, Number of dimensions, Number of dates>\nType and its entrance code: <type number>: <its entrance code>\nThen apply the vega-lite requirements of the type.\n<vega-lite> {here is the vega-lite json} </vega-lite>\n\nAnd don't use 'transformer' in your vega-lite and wrap your vega-lite json in <vega-lite> </vega-lite> tags\n"
            },
            "name": "Text2Vega",
            "type": "MLModelTool"
          }
        },
        {
          "id": "create_instruction_based_t2vega_tool",
          "type": "create_tool",
          "previous_node_inputs": {
            "register_claude_model": "model_id"
          },
          "user_inputs": {
            "parameters": {
              "prompt": "You're an expert at creating vega-lite visualization. No matter what the user asks, you should reply with a valid vega-lite specification in json.\nYour task is to generate Vega-Lite specification in json based on the given sample data, the schema of the data, the PPL query to get the data and the user's input.\n\nBesides, here are some requirements:\n1. Do not contain the key called 'data' in vega-lite specification.\n2. If mark.type = point and shape.field is a field of the data, the definition of the shape should be inside the root \"encoding\" object, NOT in the \"mark\" object, for example, {\"encoding\": {\"shape\": {\"field\": \"field_name\"}}}\n3. Please also generate title and description\n\nThe sample data in json format:\n${parameters.sampleData}\n\nThis is the schema of the data:\n${parameters.dataSchema}\n\nThe user used this PPL query to get the data: ${parameters.ppl}\n\nThe user's input question is: ${parameters.input_question}\nThe user's instruction on the visualization is: ${parameters.input_instruction}\n\nNow please reply a valid vega-lite specification in json based on above instructions.\nPlease only contain vega-lite in your response.\n"
            },
            "name": "Text2Vega",
            "type": "MLModelTool"
          }
        },
        {
          "id": "t2vega_agent",
          "type": "register_agent",
          "previous_node_inputs": {
            "create_t2vega_tool": "tools"
          },
          "user_inputs": {
            "parameters": {},
            "type": "flow",
            "name": "t2vega agent",
            "description": "this is the t2vega agent that has a set of rules to generate the visualizations"
          }
        },
        {
          "id": "t2vega_instruction_based_agent",
          "type": "register_agent",
          "previous_node_inputs": {
            "create_instruction_based_t2vega_tool": "tools"
          },
          "user_inputs": {
            "parameters": {},
            "type": "flow",
            "name": "t2vega instruction based agent",
            "description": "this is the t2vega agent that supports instructions"
          }
        }
      ]
    }
  }
}
使用响应中返回的工作流 ID 来调配资源
POST /_plugins/_flow_framework/workflow/<workflow_id>/_provision
要查看工作流和所有已创建资源的状态,请发送以下请求
GET /_plugins/_flow_framework/workflow/<workflow_id>/_status
步骤 3:配置根代理
接下来,配置一个用于文本到可视化的根代理
POST /.plugins-ml-config/_doc/os_text2vega
{
  "type": "os_chat_root_agent",
  "configuration": {
    "agent_id": "<ROOT_AGENT_ID>"
  }
}
配置代理以接收用于创建可视化的用户指令
POST /.plugins-ml-config/_doc/os_text2vega_with_instructions
{
  "type": "os_chat_root_agent",
  "configuration": {
    "agent_id": "<ROOT_AGENT_ID>"
  }
}
此示例演示了一个系统索引。在启用安全性的域中,只有超级管理员才有权限执行此代码。有关进行超级管理员调用的信息,请参阅系统索引。有关访问权限,请联系您的系统管理员。
步骤 4:测试代理
您可以通过使用示例负载调用代理来验证代理是否已成功创建
POST /_plugins/_ml/agents/<ROOT_AGENT_ID>/_execute
{
  "parameters": {
    "input_question": "find unique visitors and average bytes every 3 hours",
    "input_instruction": "display with different layers, use independent scale for different layers, display unique visitors with light blue bar chart",
    "ppl": "source=opensearch_dashboards_sample_data_ecommerce| stats DISTINCT_COUNT(user) as unique_visitors, AVG(taxful_total_price) as avg_bytes by span(order_date, 3h)",
    "sampleData": """[{\"unique_visitors\":15,\"avg_bytes\":90.98684210526316,\"span(order_date,3h)\":\"2024-04-25 00:00:00\"},{\"unique_visitors\":14,\"avg_bytes\":72.72083333333333,\"span(order_date,3h)\":\"2024-04-25 03:00:00\"}]""",
    "dataSchema": """[{\"name\":\"unique_visitors\",\"type\":\"integer\"},{\"name\":\"avg_bytes\",\"type\":\"double\"},{\"name\":\"span(order_date,3h)\",\"type\":\"timestamp\"}]"""
  }
}
从文本生成可视化
您可以通过调用 /api/assistant/text2vega API 端点从文本生成可视化。input_instruction 参数是可选的
POST /api/assistant/text2vega
{
  "input_instruction": "<input_instruction>",
  "input_question": "<input_question>",
  "ppl": "<ppl_query>",
  "dataSchema": "<data_schema_of_ppl_response>",
  "sampleData": "<sample_data_of_ppl_response>"
}
下表描述了文本到可视化 API 参数。
| 参数 | 必需/可选 | 描述 |
|---|---|---|
input_question | 必需 | 用于生成相应管道处理语言 (PPL) 查询的用户原始问题。 |
ppl | 必需 | 生成的 PPL 查询,用于检索可视化所需的数据。 |
dataSchema | 必需 | 根据 PPL 响应,描述可视化输出中数据字段的结构和类型。 |
sampleData | 必需 | 提供将填充可视化的数据样本条目。 |
input_instruction | 可选 | 指定可视化的样式指令,例如颜色。 |
在 OpenSearch Dashboards 中从文本生成可视化
要在 OpenSearch Dashboards 中从文本生成可视化,请按照以下步骤操作
-
在顶部菜单栏上,转到 OpenSearch Dashboards > 可视化,然后选择创建可视化。
-
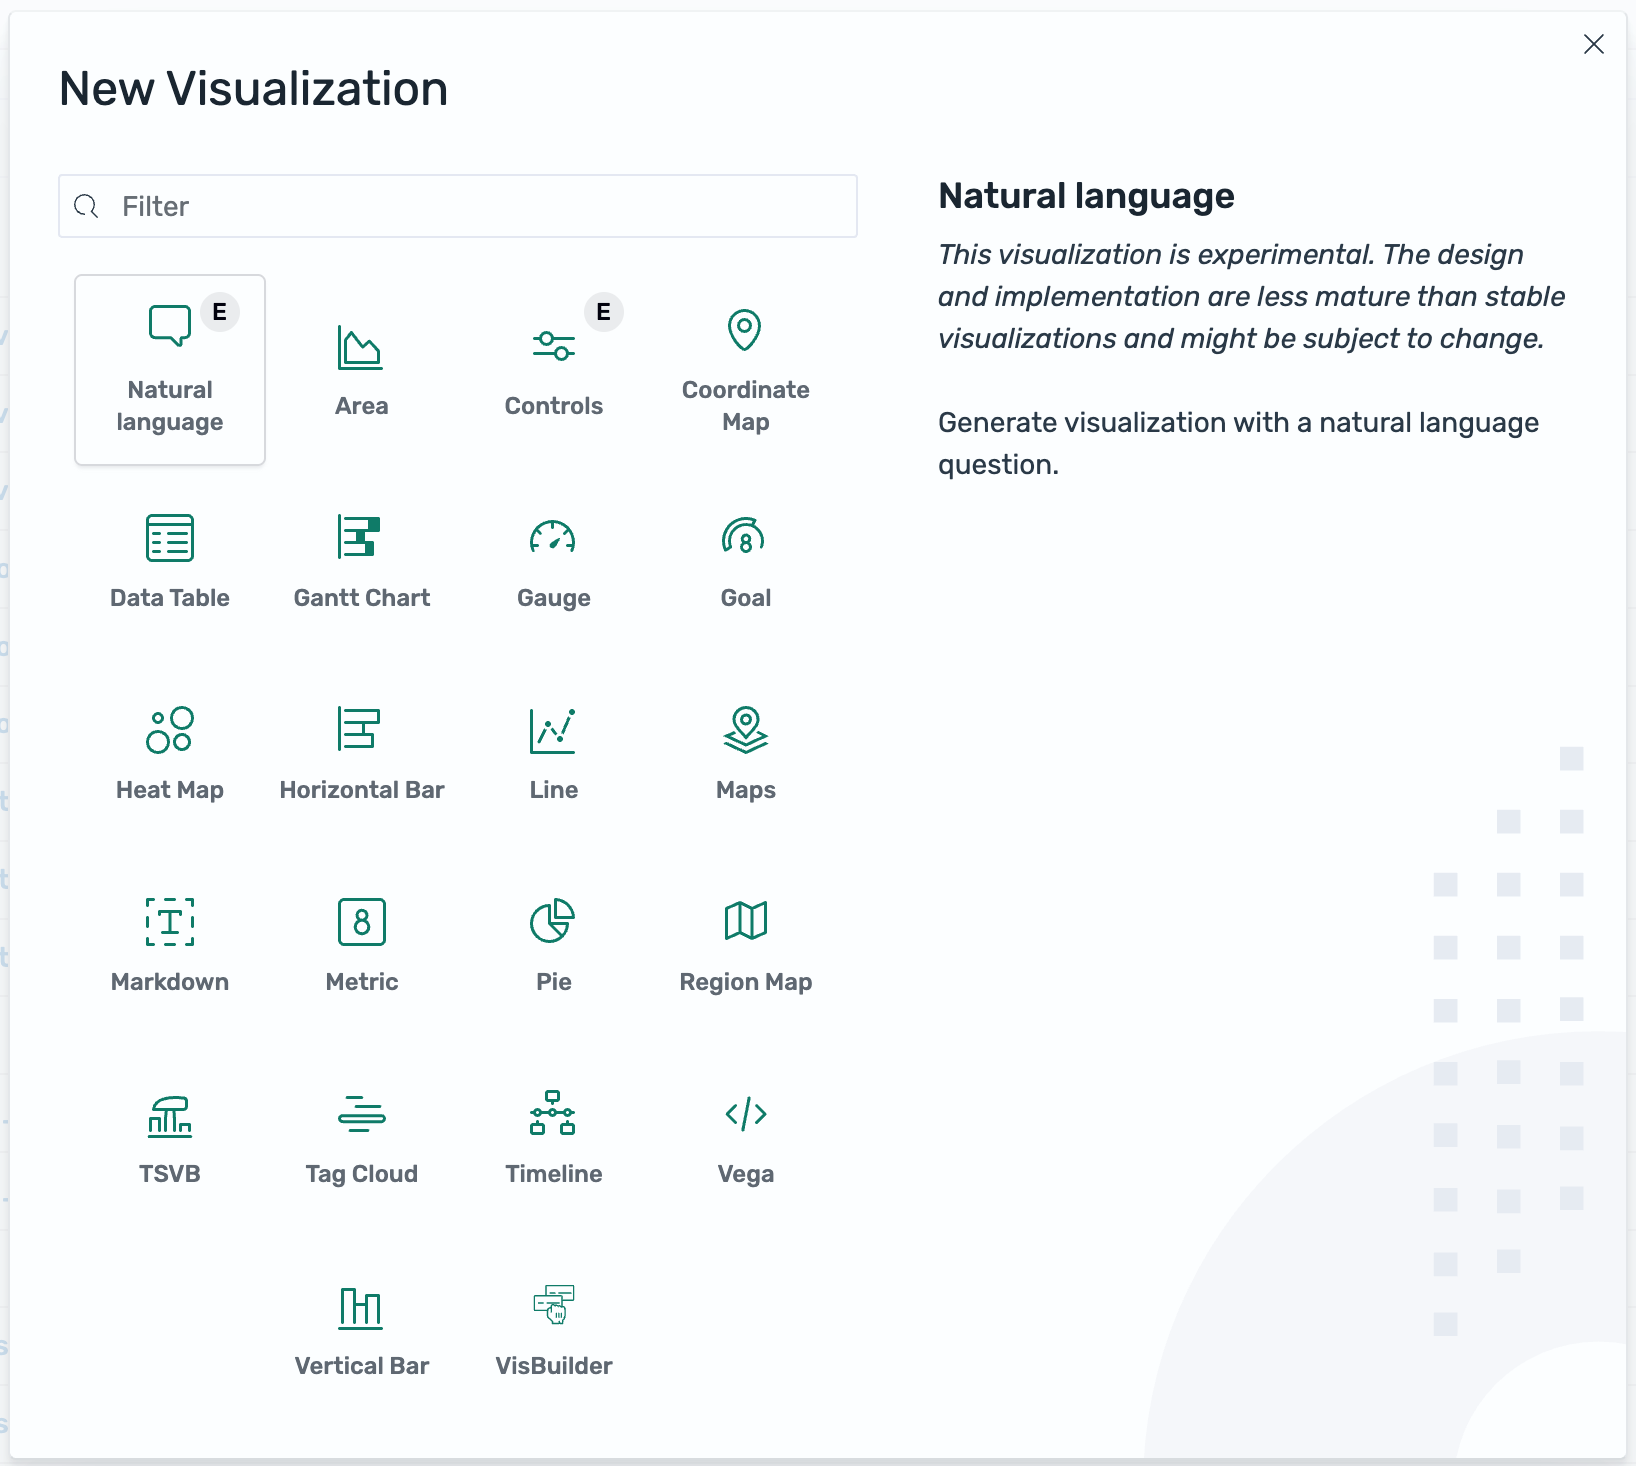
在新建可视化对话框中,选择自然语言,如下图所示。
-
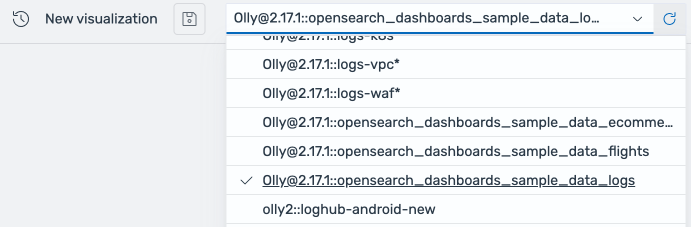
从数据源下拉列表中选择一个数据源,如下图所示。
-
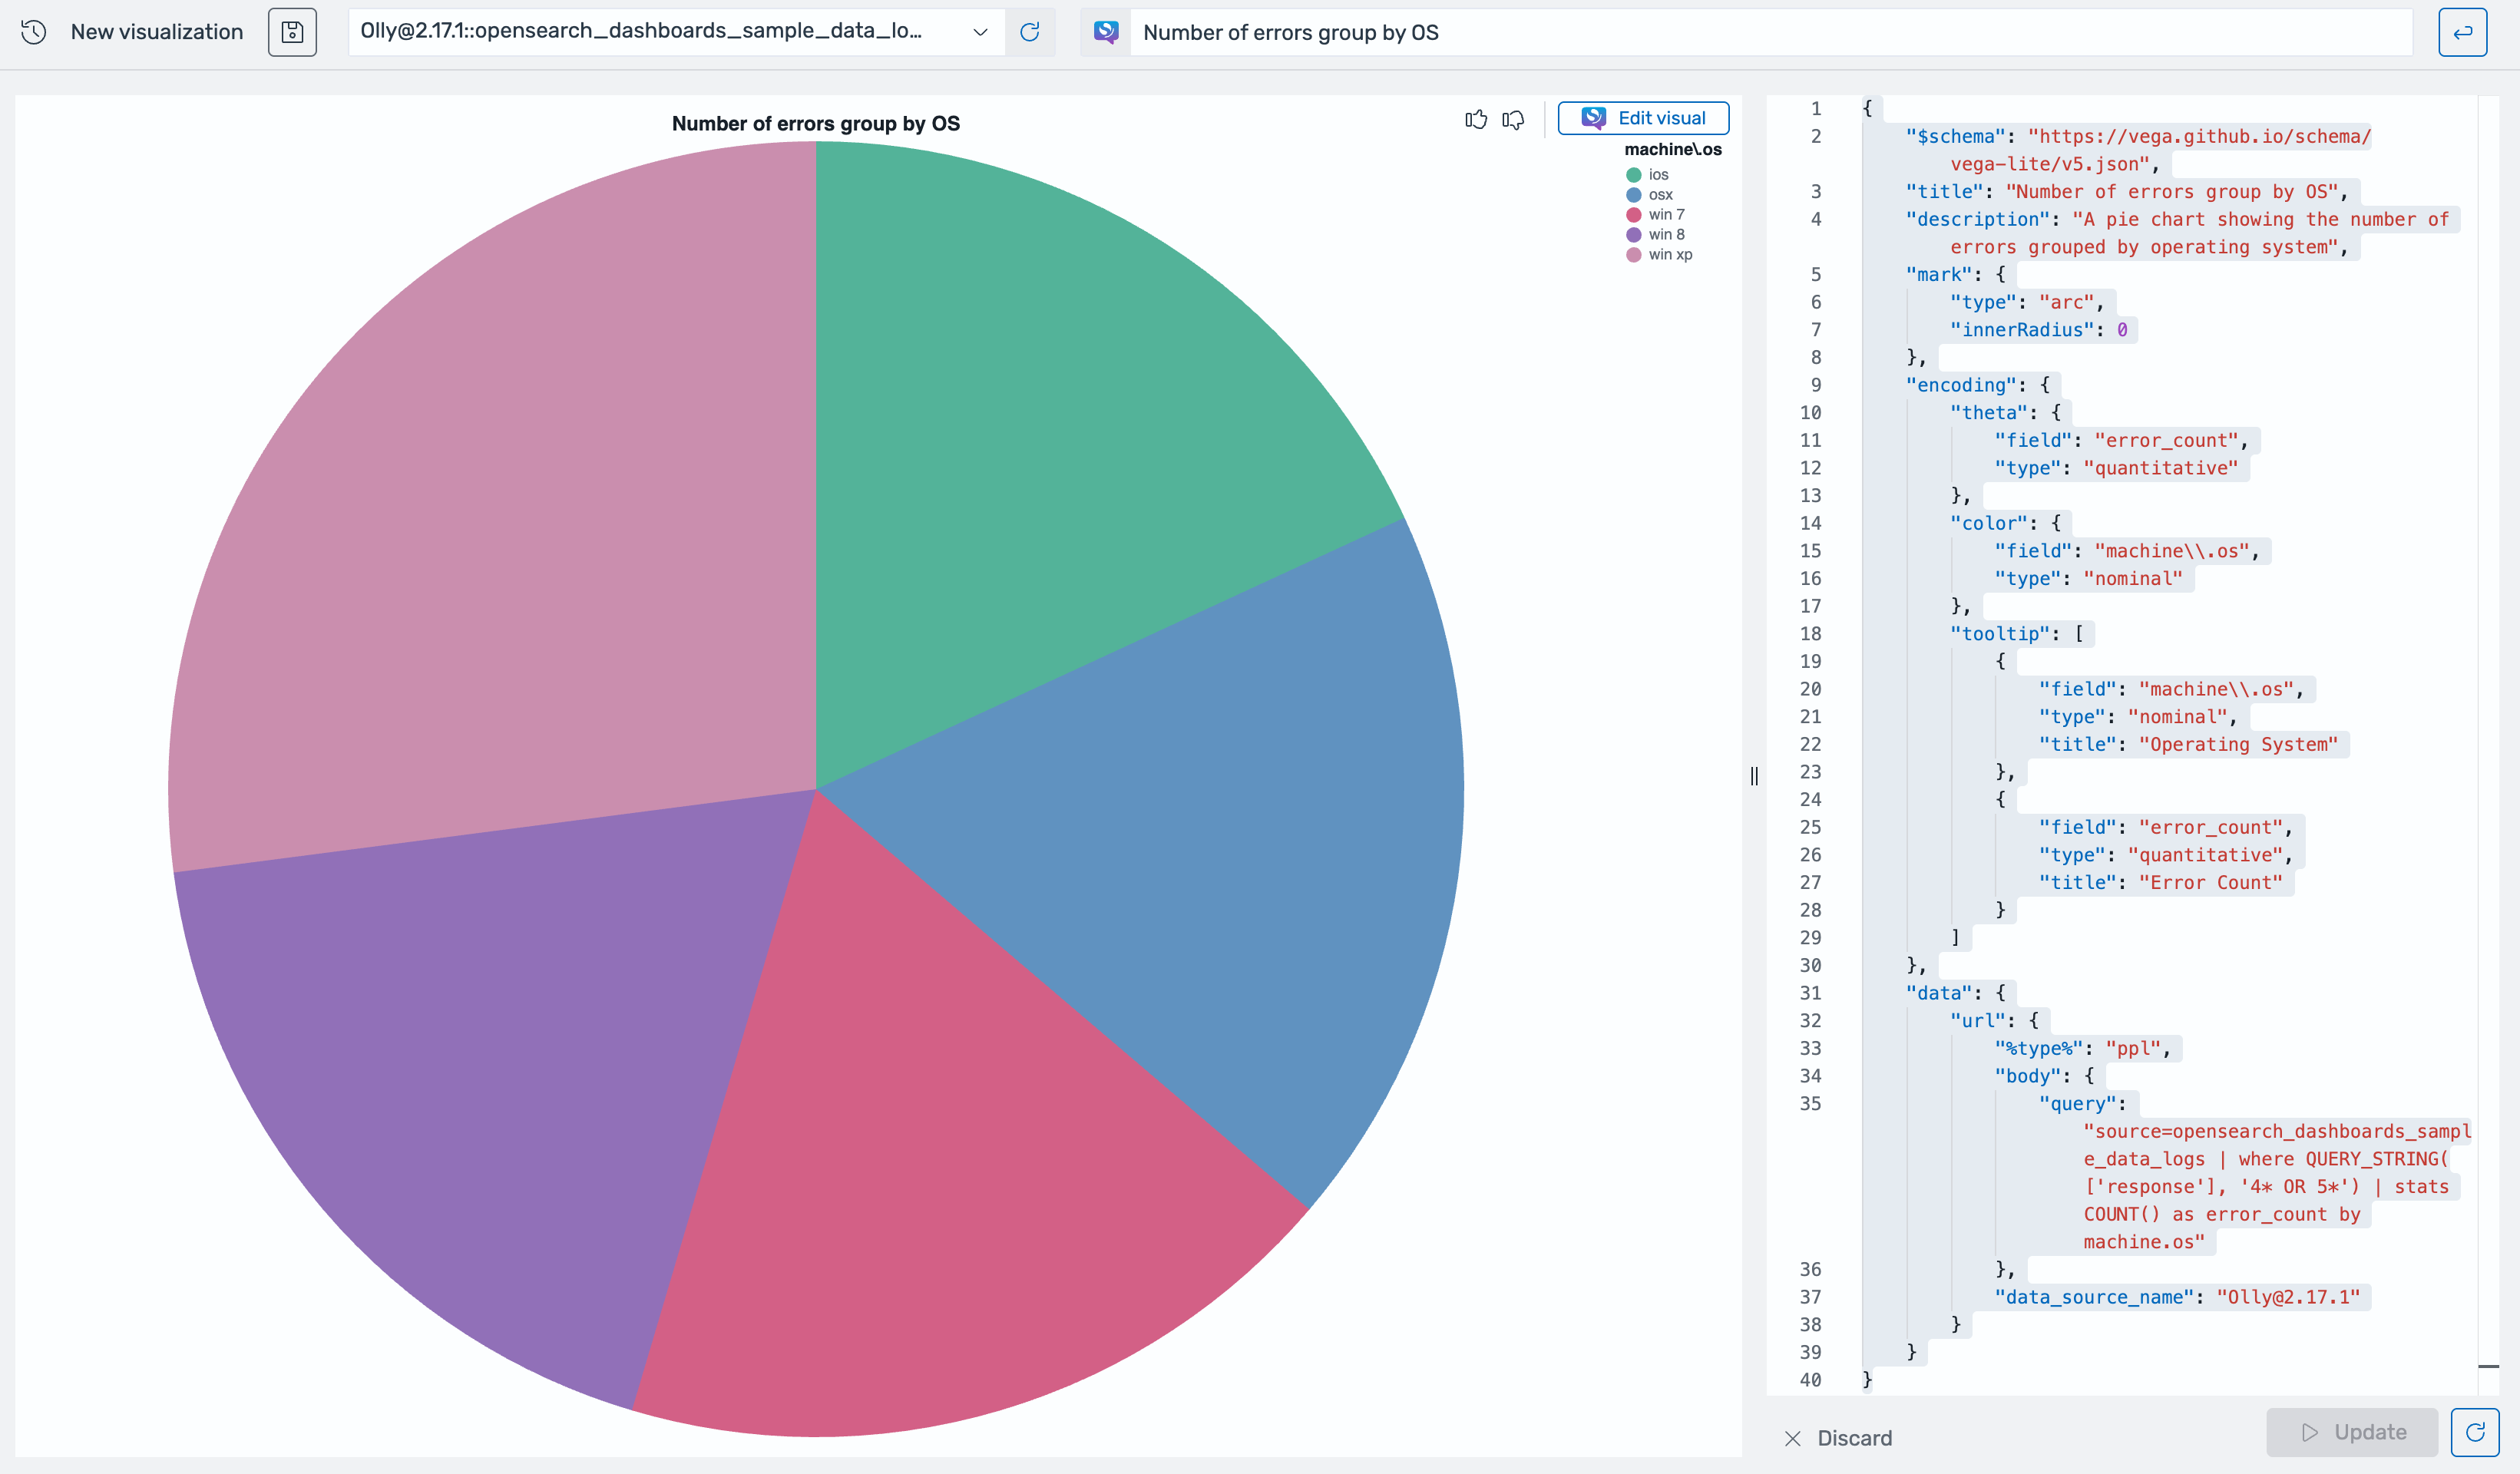
在右上角的文本框中,使用自然语言输入一个问题。将生成一个新的可视化,如下图所示。
-
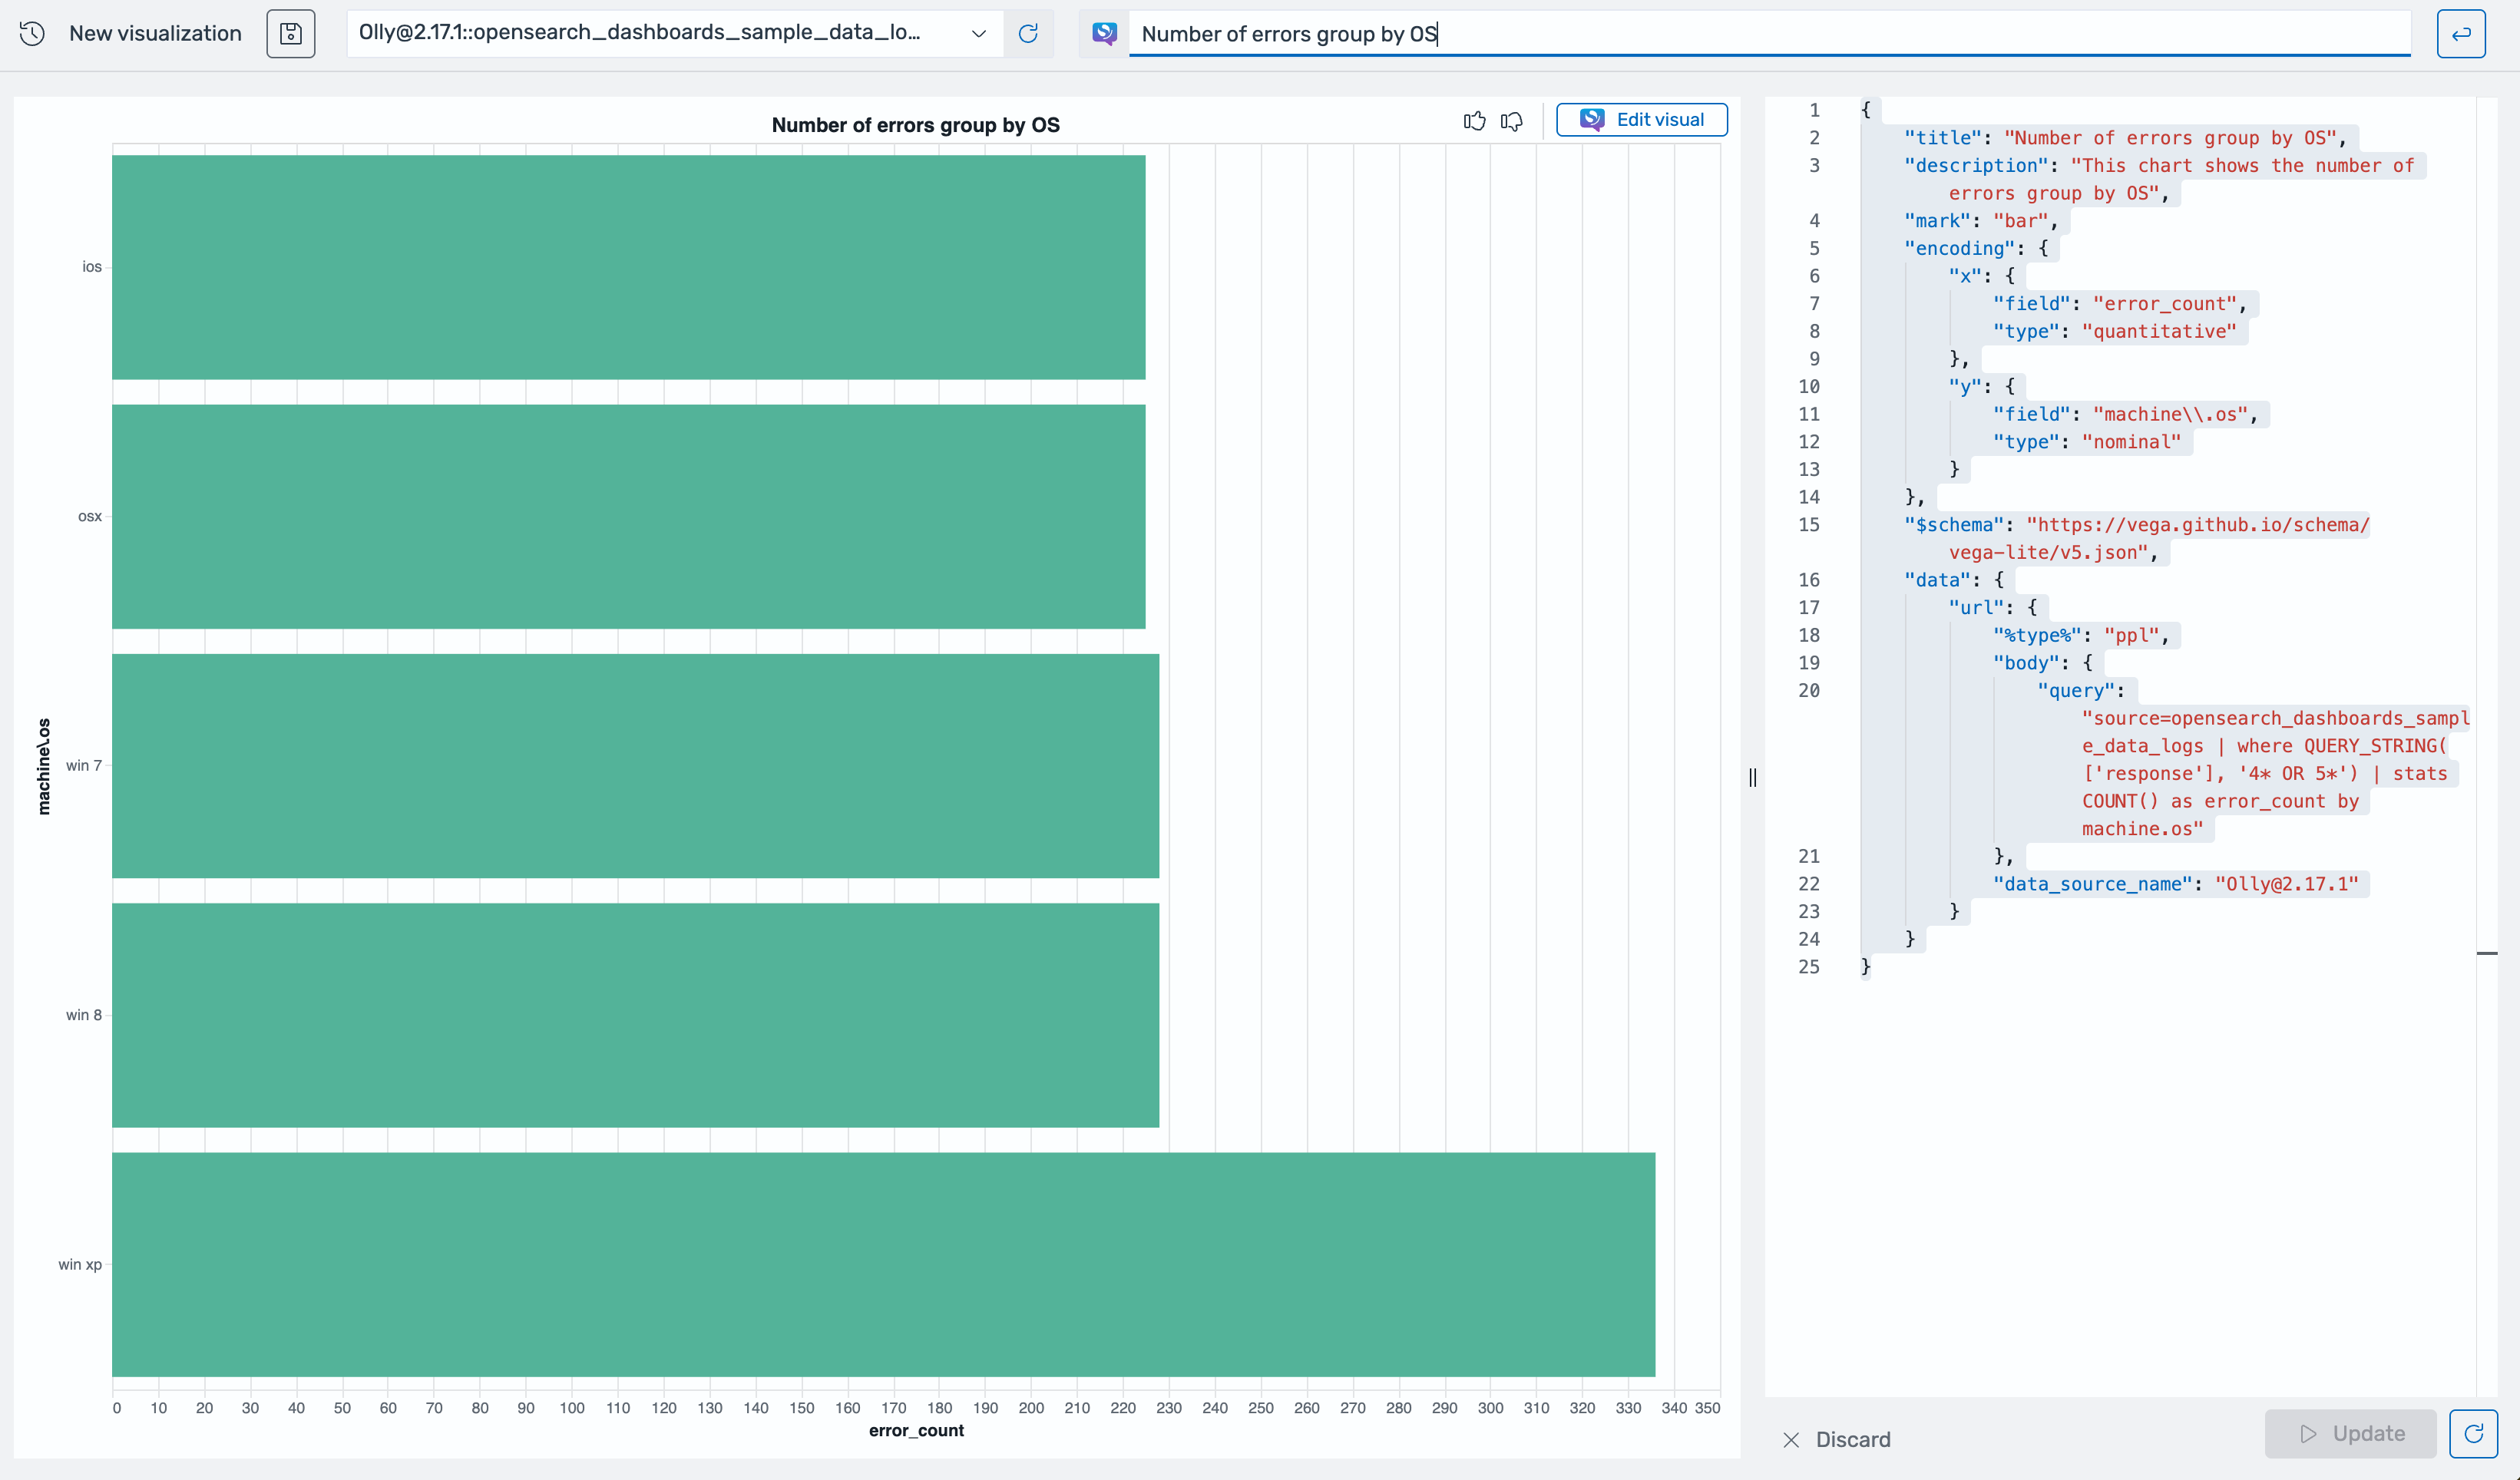
要修改生成的可视化,请选择编辑可视化。在编辑可视化对话框中,输入所需的修改,然后选择应用,如下图所示。
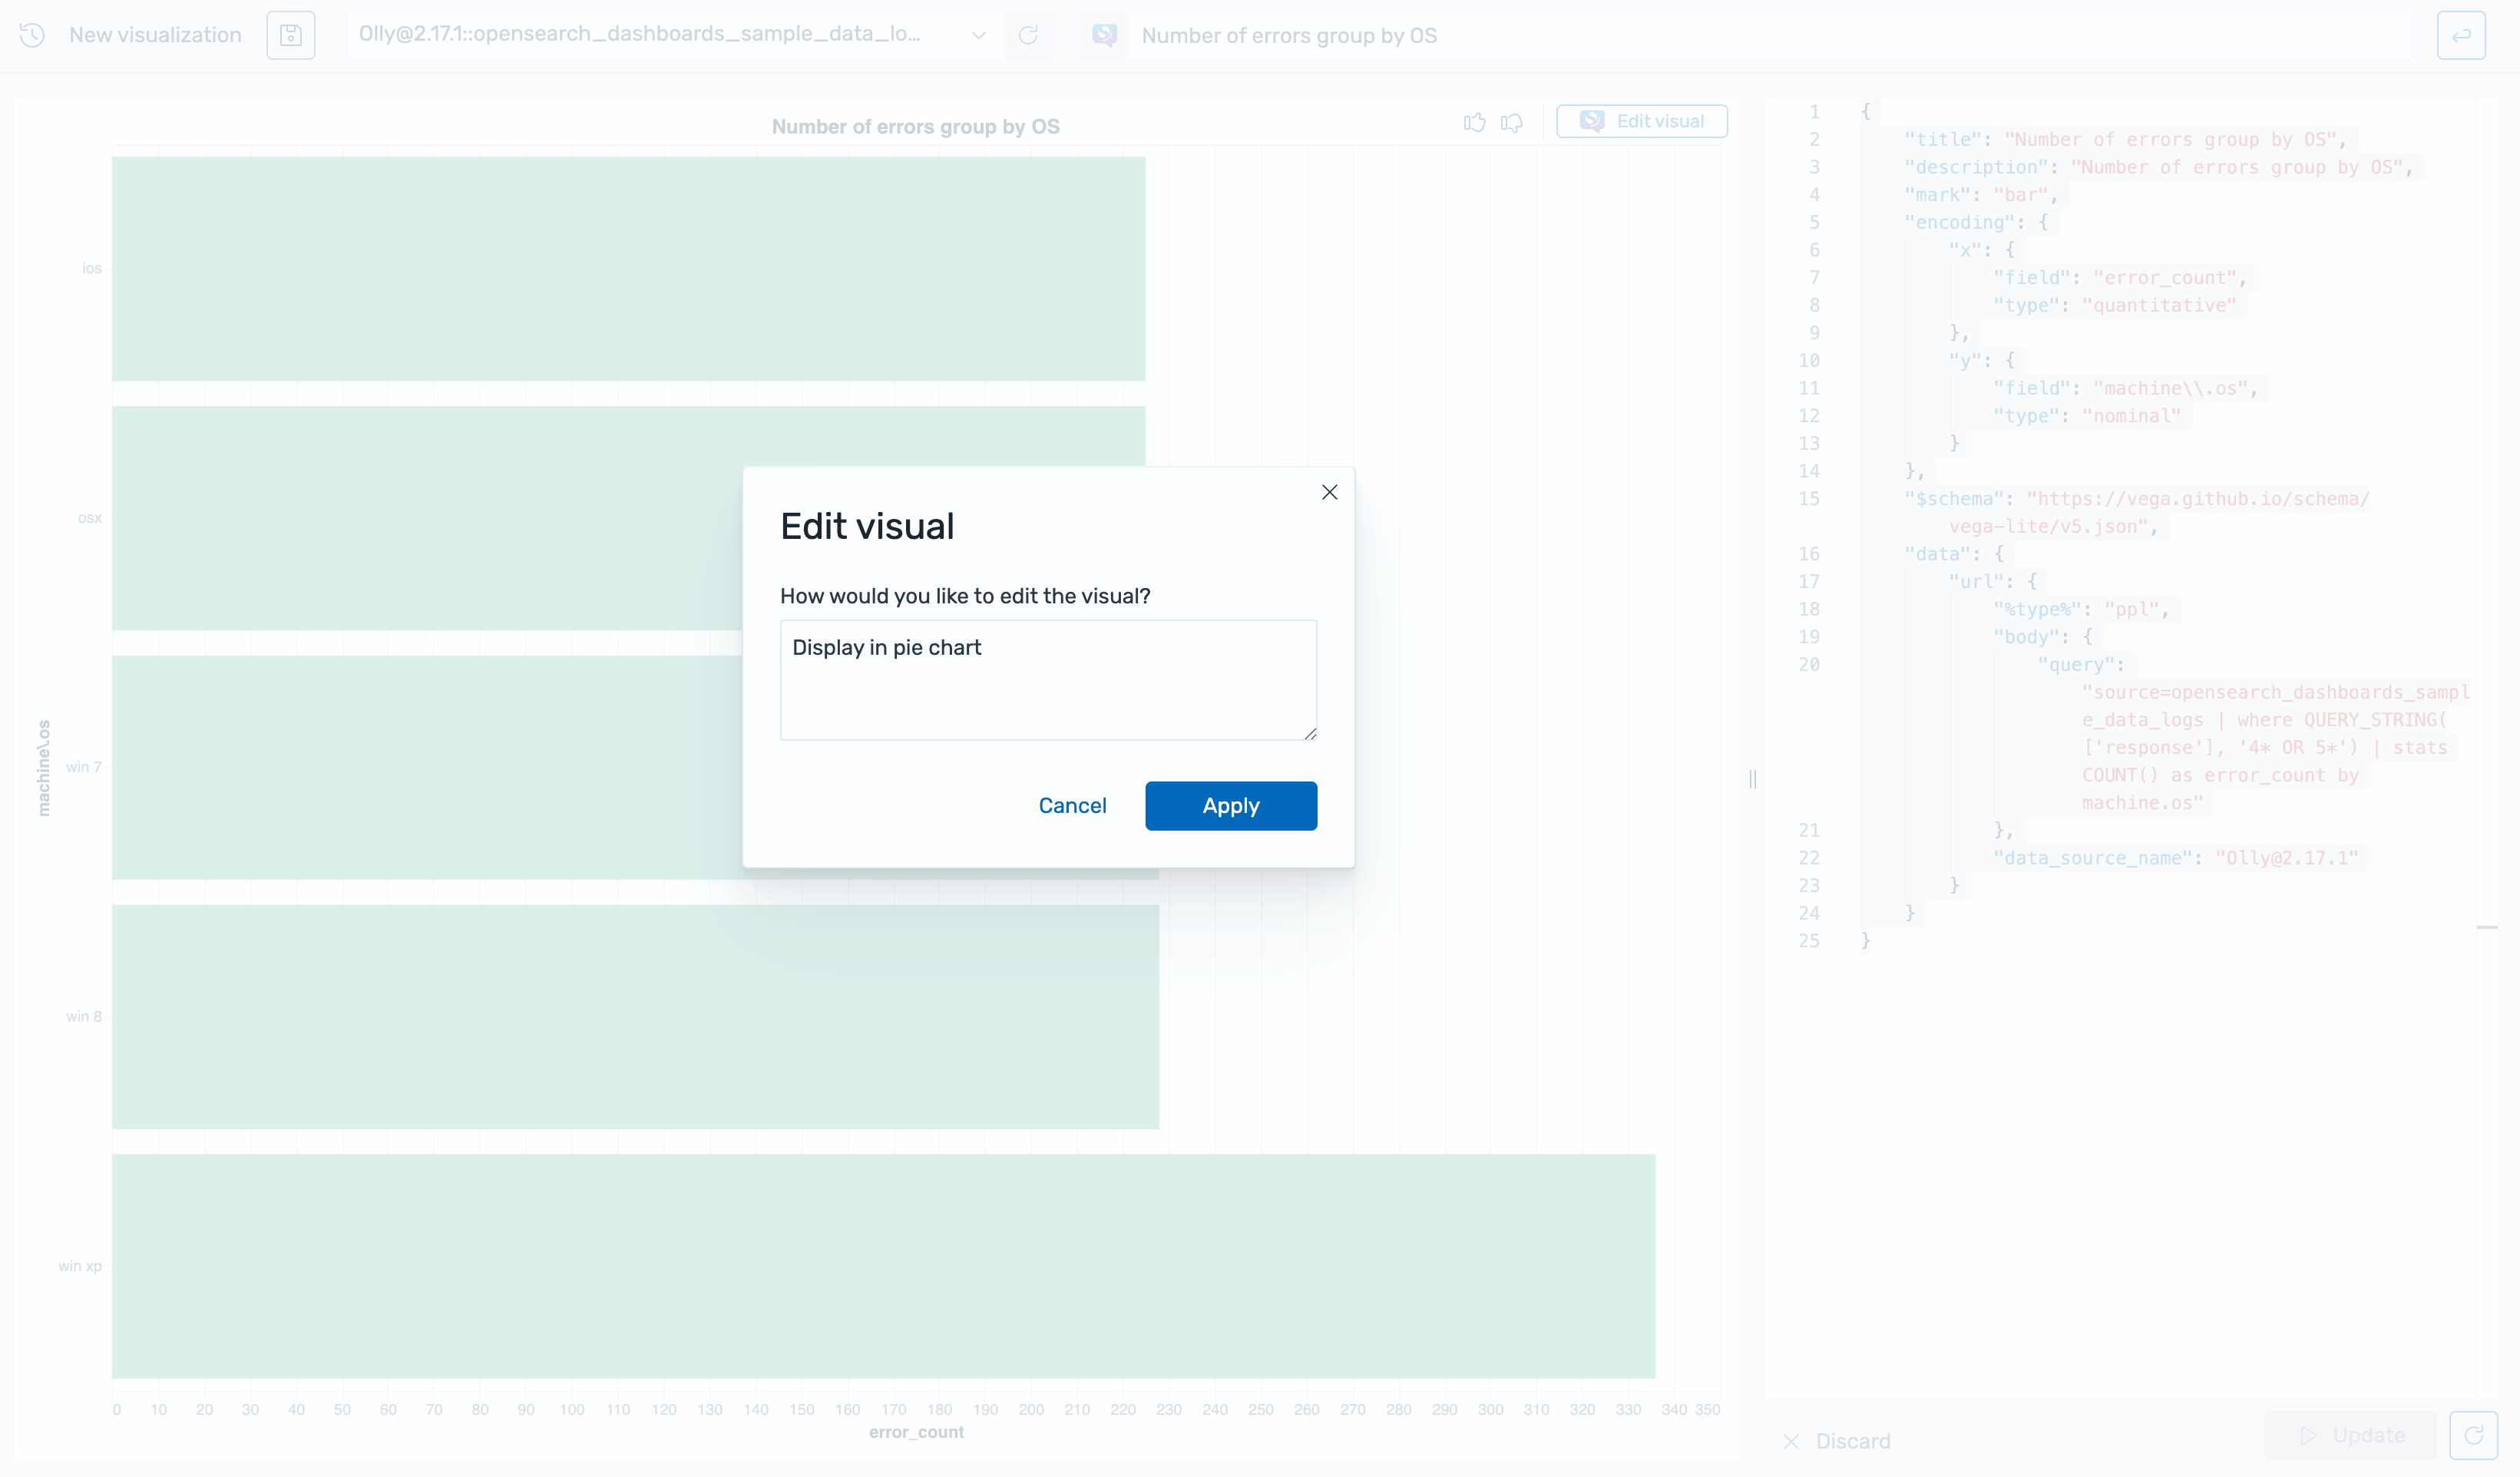
可视化已更新,如下图所示。